Runecast is a Proactive monitoring solution which is using the known issue profiles and best practices documented in the VMware Knowledgebase and other sources to identify and expose potential issues within your VMware infrastructure before they manifest into outages.In this post we will do a product Walkthrough , deployment and configuration of the Runecast Analyzer v 2.5 .
Runecast Analyzer comes as a virtual appliance in OVA format which you deploy in your virtual infrastructure. It can do a lot more than just monitoring like collect logs from ESXi hosts and analyze those which helps in detecting any misconfigurations or issues.
The Runecast appliance consists of a single virtual machine running Ubuntu Server 14.x with all application components preinstalled and preconfigured. It is less than 1.3GB in size and latest version can be freely downloaded from your runecast.biz Web Portal. The deployment is similar to any other OVA deployment and would take you as little as 1 minute.
Runecast Analyzer deployment you will achieve
- Save time and efforts
- Ensure security, since no data is uploaded over to the Internet
- Eliminate the need for Internet connectivity by using offline updates
- Ensure continuous compliance by applying automated KB, application and OS updates
- Quickly and securely get value out of all Runecast features: VMware KB Scan, Compliance Checks and Log analysis.
Supported Platforms
- VMware vSphere infrastructure deployed with vCenter and ESXi 5.X or 6.X and above, since vSphere 5.X is EOL recommended to use vSphere 6.X environments on production.
- Runecast Analyzer supports NSX Manager v6.2 and above
- Runecast Analyzer supports Horizon v6.x and above.
- Runecast Analyzer Support vSAN
Deployment Models and system Requirements
System requirements for the Runecast Analyzer are deiced based on the size of the appliance you select and Runecast Analyzer can be deployed in three different sizes Small , Medium and Large .
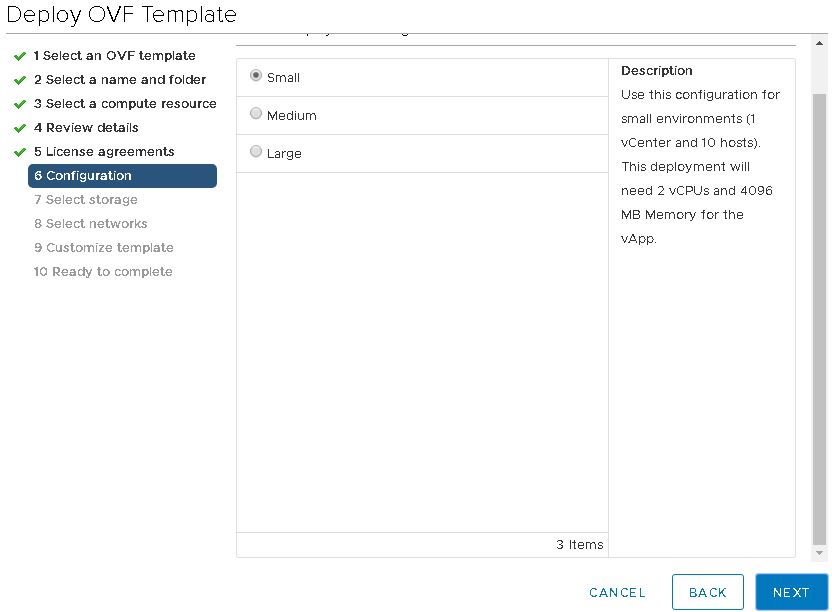
Small:- This model can be used for small environments: up to 25 Hosts and it required 2 vCPU , 4 GB RAM , 120 GB Storage and 100 Mbit network (1GBit or above recommended)
Medium:- This model can be used for medium deployments: up to 150 Hosts and it required 4 vCPU , 8 GB RAM ,120 GB Storage and 100 Mbit network (1GBit or above recommended)
Large :- This model can be used for large deployments: up to 400 Hosts and it required 8 vCPU , 32 GB RAM ,120 GB Storage and 100 Mbit network (1GBit or above recommended)
Permission Required
A user with the Read Only access to vCenter level is Minimum required for performing scanning. With read only permission collection will not be fully comprehensive and it will not be possible to report issues related to some areas of the configuration like ESXi hosts driver, firmware etc . Refer the Runecast User Guide to check the required all the permission.
Required Ports
- From Runecast appliance to vCenter and ESXi hosts – 443, 5988, 5989
- From ESXi hosts to Runecast Analyzer for log collection – 514 UDP
- To the Runecast Analyzer web interface – 443, 31415
- From Runecast appliance to NSX Manager – 443
- To the Runecast appliance from vCenter for the web client / vRealize Orchestrator plugin – 443
- To the Runecast appliance from any client using the Runecast API – 443From Runecast appliance to Connection Server – 443
Why Internet Connectivity Required?
To download zero-touch updates for knowledge definitions and application updates Runecast Analyzer can be connected to the Internet to. Also a fully off-line update mechanism is provided using files (.ISO and .bin) made available from the user portal. Note that no data is transmitted from the Runecast Analyzer outside of your data center.
How to Acces Runecast Analyzer Web Interface
Runecast Analyzer Web Interface can be accessed from Chrome v68.0.3440.106 and newer, Firefox v50.0.2, MS Edge v38.14393.0.0 and newer using https://ipaddress or FQDN of the appliance .
Download Runecast Analyzer
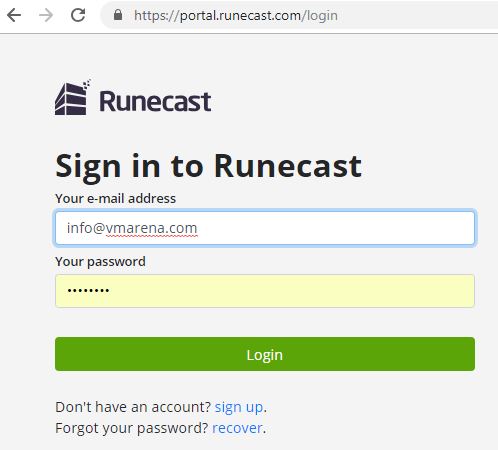
From Runecast website, create your account and sign in to download the software.
Create Account by proving require information and you will get mail to confirm the account activation
Login to the Account from Runecast and Download the Appliance
Runecast Analyzer Deployment
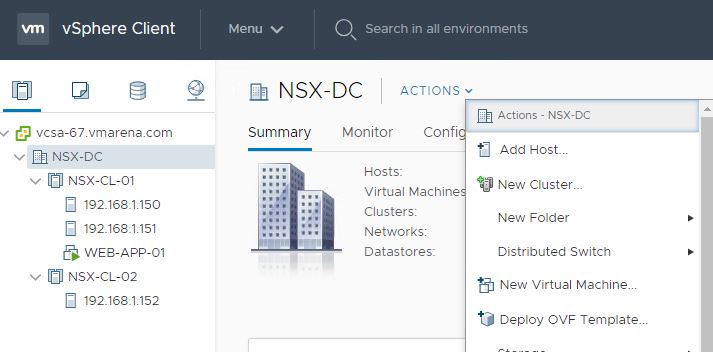
Open the vCenter Server Web /HTML Client and navigate to Datacenter to install Runecast -> Action -> select Deploy OVF Template
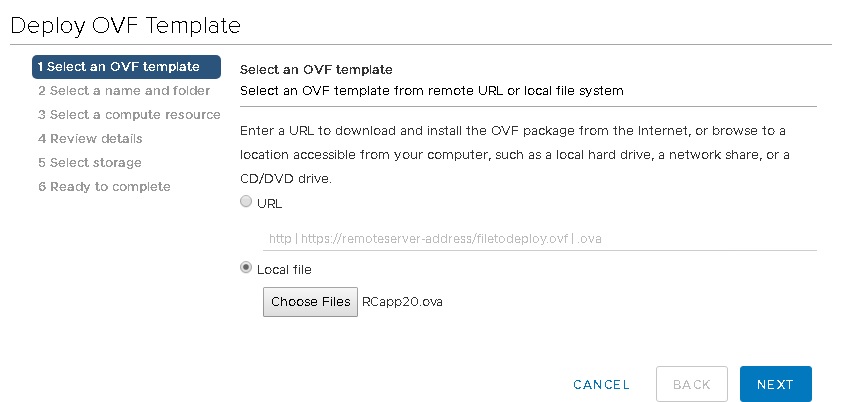
Click Choose Files andselect the downloaded OVA file then click Next.
Provide a Name to the appliance and select the desired Folder and Click Next.
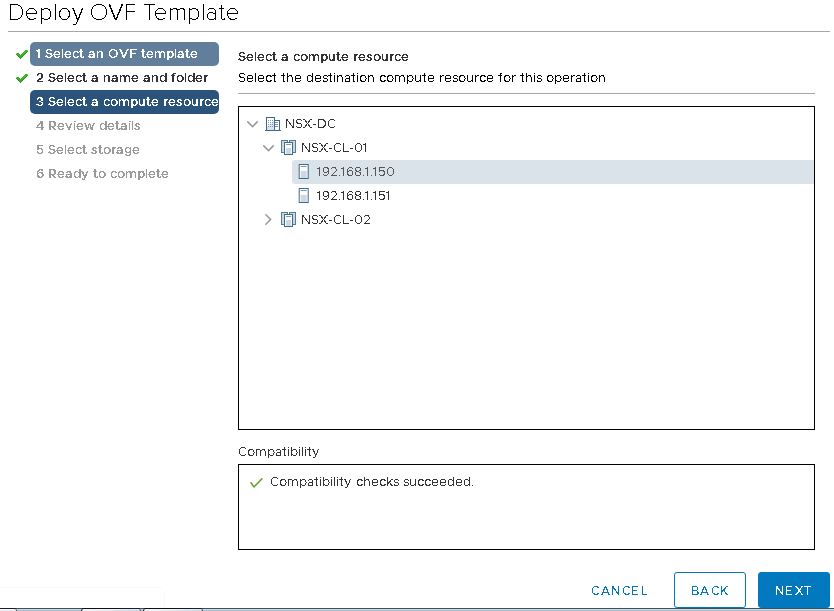
Select the compute resource which host from which cluster and data center and click next
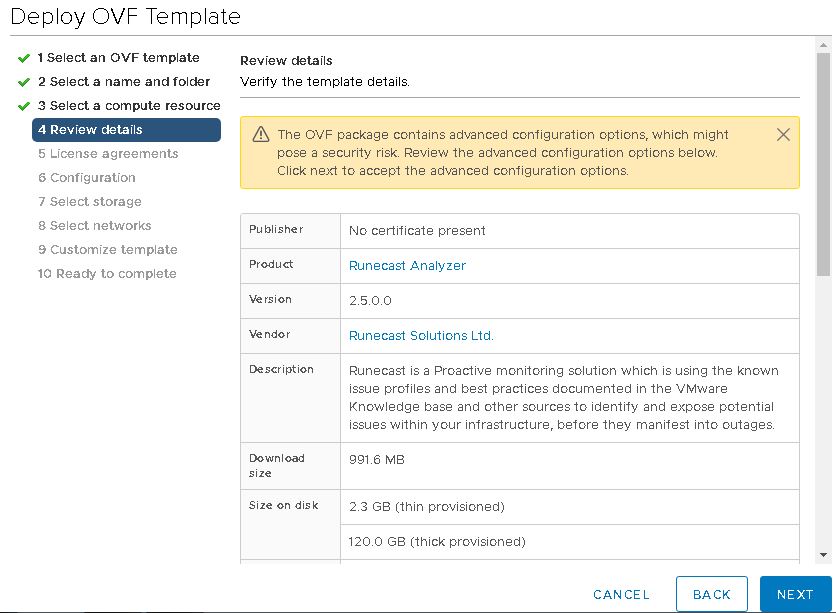
Review the details and Click Next to continue.
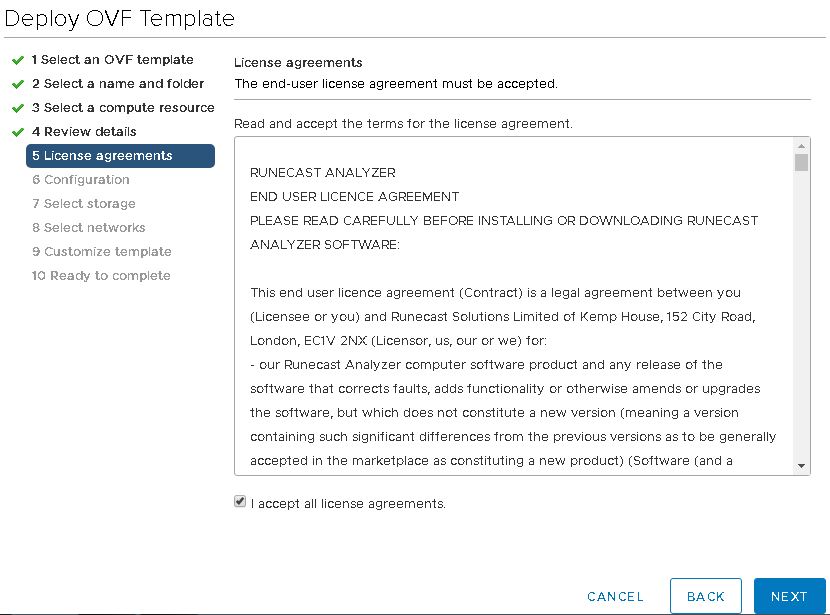
Select Accept all license agreements option to accept the EULA and click Next
Select the deployment model small , medium or Large and Click Next
Select the storage and virtual disk from mat and click Next to continue
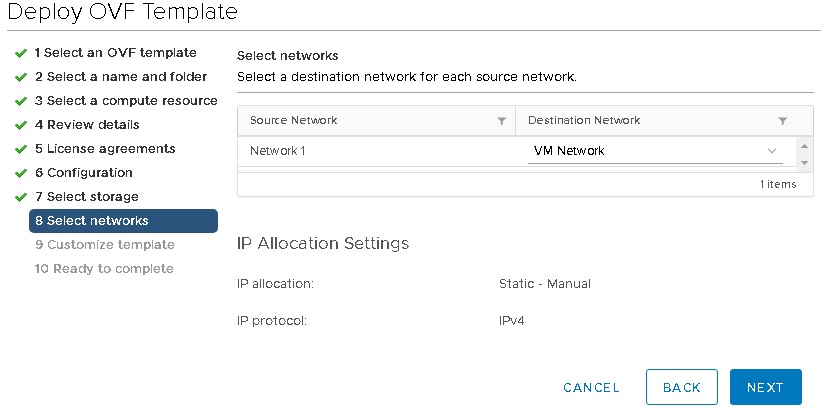
From next window slect the appropriate network port group and click Next
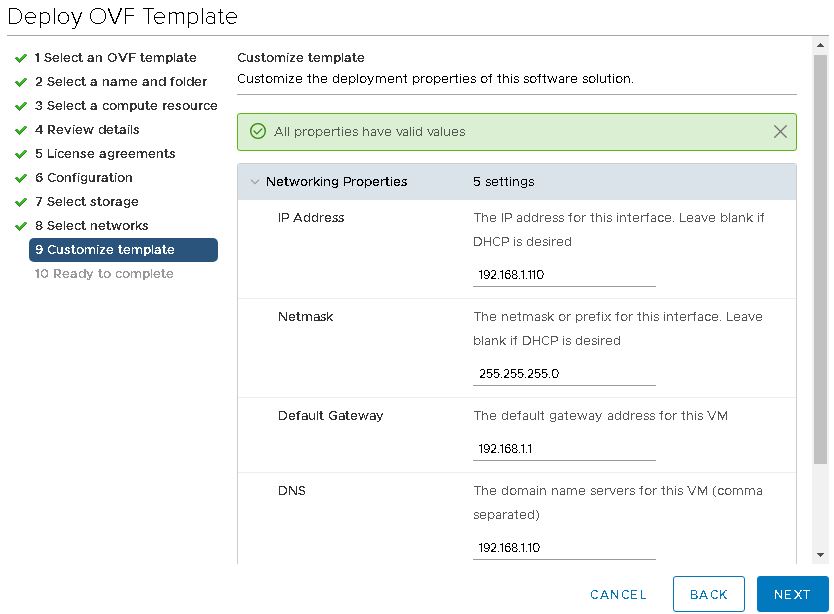
Assign the the Static IP address , Subnet , Gateway , DNS and NTP and click next , also if you want to choose DHCP you can leave IP details as blank
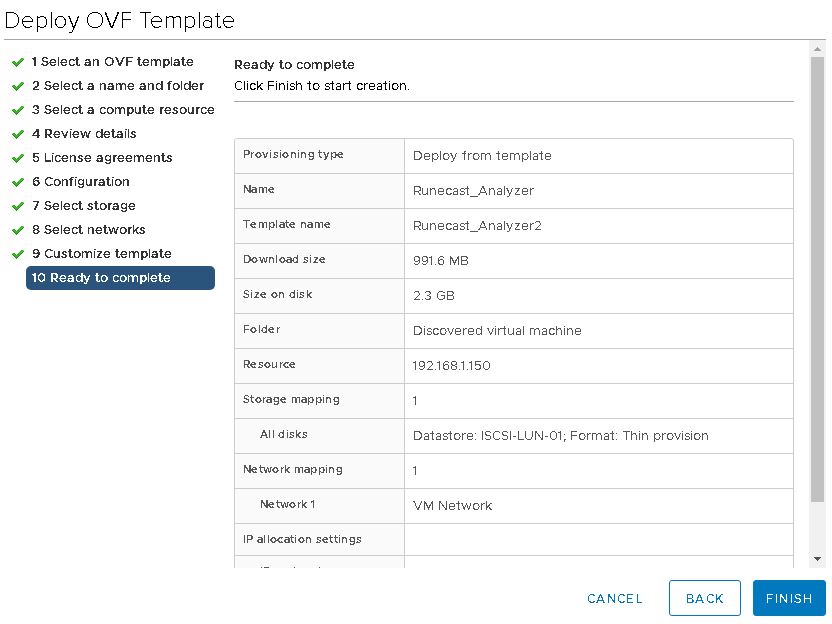
Review the complete details and click Finish and deployment will start
Configure the appliance
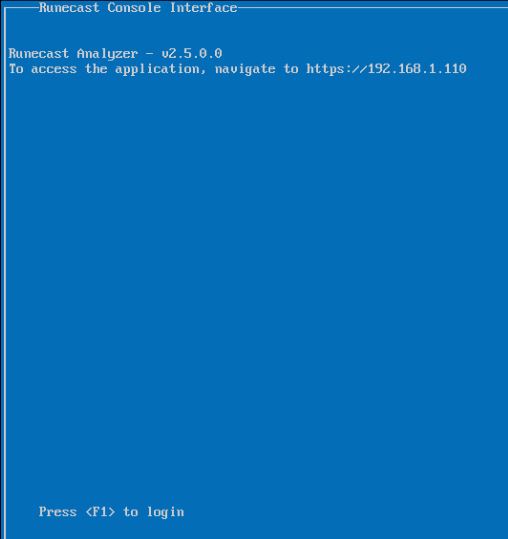
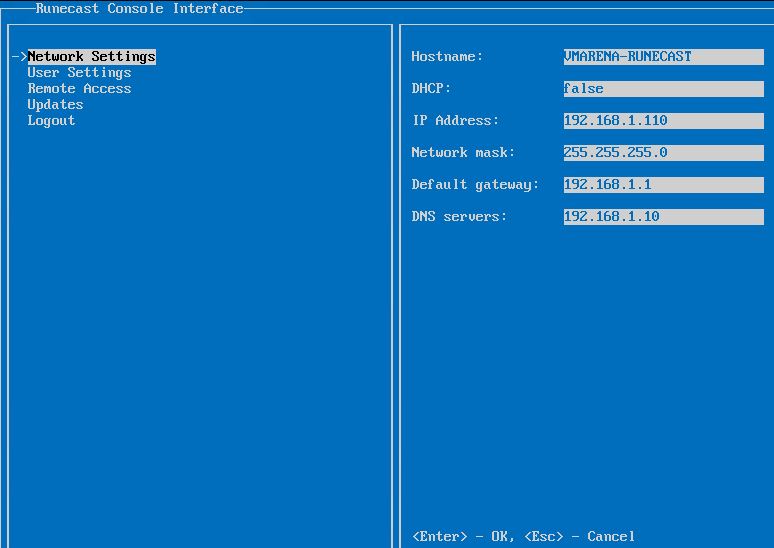
Once the appliance have been deployed, open the VA console and you can verify the ip address , also you have option to change ip address and password of rcadmin from console
Login Console Using by Pressing F1 key and rcadmin username and admin as password
You can set the host name and network from here , also chnage password remote access and update setting once completed logout .
Access the Runecast Analyzer and Configure vSphere Environment
Open the supported browser access the Runecast Analyzer Web Interface by typing the address or FQDN https://IP_Address_or_FQDN
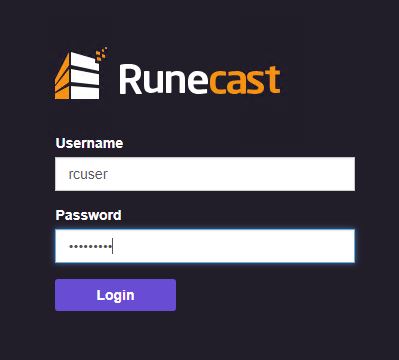
Login using with default User name and Password (rcuser/Runecast!) and click Login
On the first login you will be prompted to configure a connection to the vCenter server since there is no vCenter connections available .
Enter the vCenter details and Continue to the next step
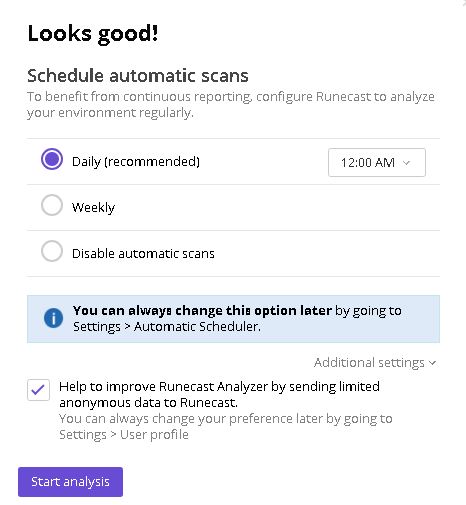
After successful connection new windows will prompt to configure automatically scheduled scans. You can schedule it as daily , weekly also automatic scan disable option available .
Optionally you select the option for help to improve Runecast Analyzer by sending limited anonymous usage data also you change this preference any time from Settings -> User Profile
Click on start the analysis to and it will take few minutes to finish , to view the details of the issues found ,you have license your Runecast Anlyzer .
License Your Runecast Analyzer Appliance
Click on to Settings (Gear icon ) from right side of the main console and navigate to License option
Click on Add license option ->provide a description -> browse the license file and click Add license
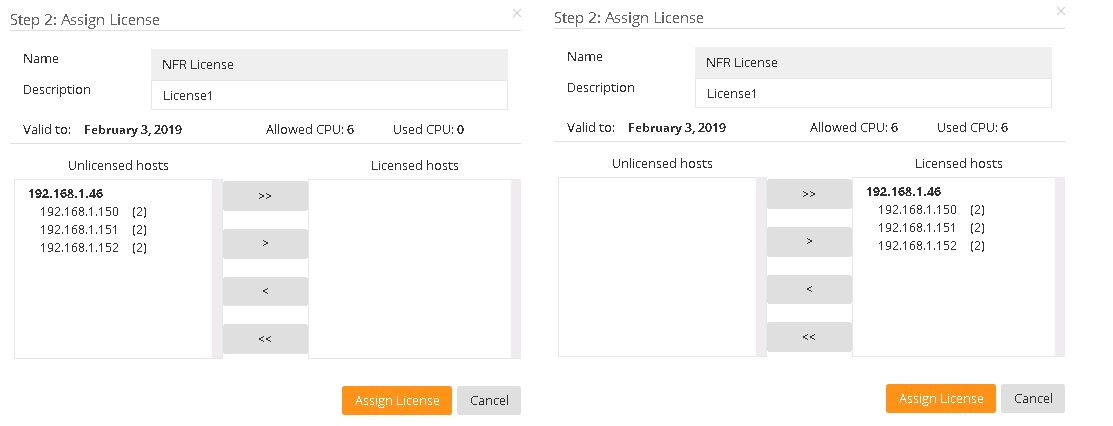
New page will appear and you can view the unlicensed hosts and you can add them to licensed hosts Tab using “> or >> ” icon and click Assign License
After License Applied you can view the license hosts details there , license expiry etc .
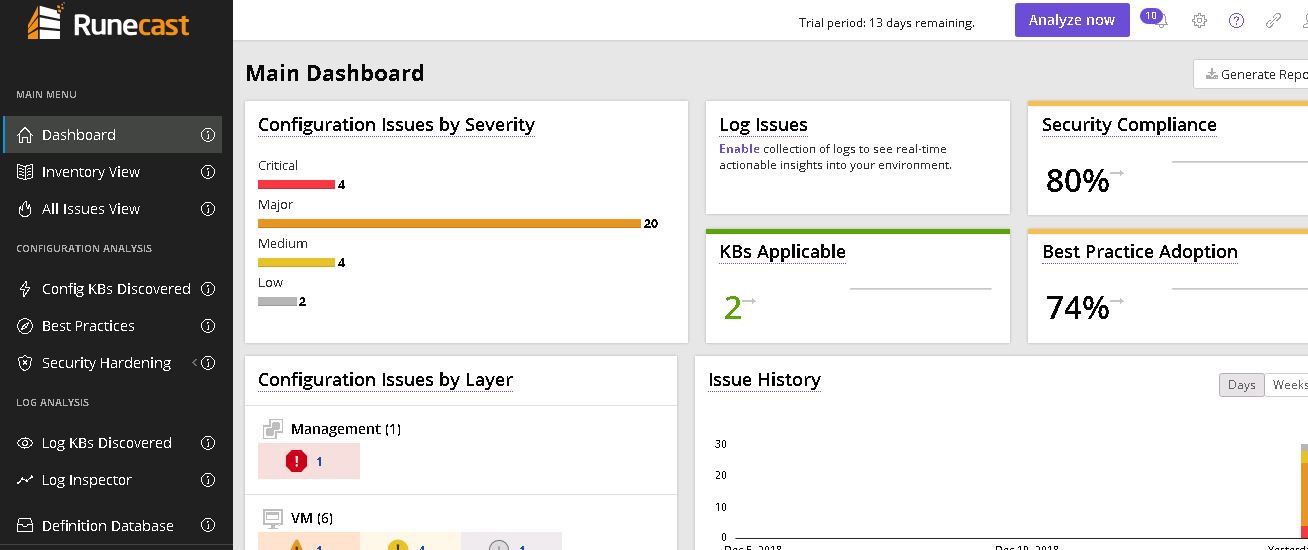
Navigate to the home page -> Dashboard and you can view the main dash board which display the result of the analysis.
Start your Free Trial Today
Runecast Analyzer Licensing & Pricing
Runecast Analyzer licensing is based on the number of physical CPU sockets of the ESXi hosts (regardless the number of cores), with multi-tiered pricing and annual subscription options (1 or 3 years) – to accommodate the needs of any organization, from small business to enterprise
To keep things simple, we offer one type of license, which includes all functionalities and integrations with vSphere, vSAN, NSX and Horizon. It’s based only on the number of CPU sockets of the ESXi hosts (not the number of vCenters, NSX Managers or Horizon Connection servers).
More Details Check out https://www.runecast.com/licensing-and-pricing
Conclusion
We did a walk-through of Runecast Analyzer and shared the procedure to deploy Runecast and initial configuration with VMware vSphere Infrastructure. Runecast is one of the best tools to perform predictive analytics for VMware vSphere environments. It helps to mitigate service outages, increase security and compliance and reduce time in troubleshooting. We will be sharing more details of the dashboard how it helps to mitigate the issue , other configurations in upcoming logs posts .


