VIMTOP – Monitor vCenter Server Appliance 6.5
vimtop is tool to monitor vCenter server appliance 6.5 performance information and statistics. vimtop is similar to esxtop which is available with ESXi. vimtop is the tool which helps you to troubleshoot performance issues or bottlenecks in the vCenter Server appliance
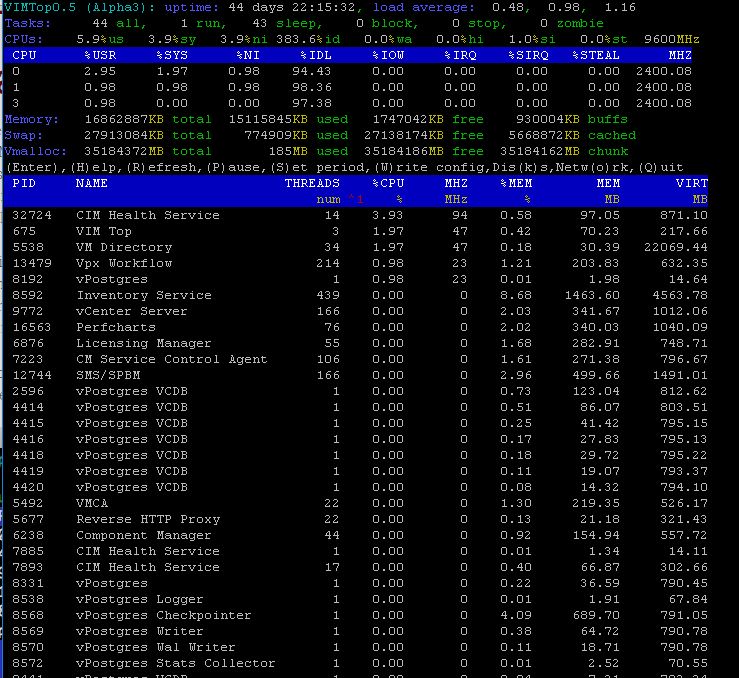
To launch vimtop, you will need to SSH to a VCSA 6.0 system and type “vimtop” in either the applianceshell or in a regular bash shell. When vimtop is launched, It displays the memory and CPU usage information along with the process or service name running on the VCSA along with its respective memory and CPU usage percentage.

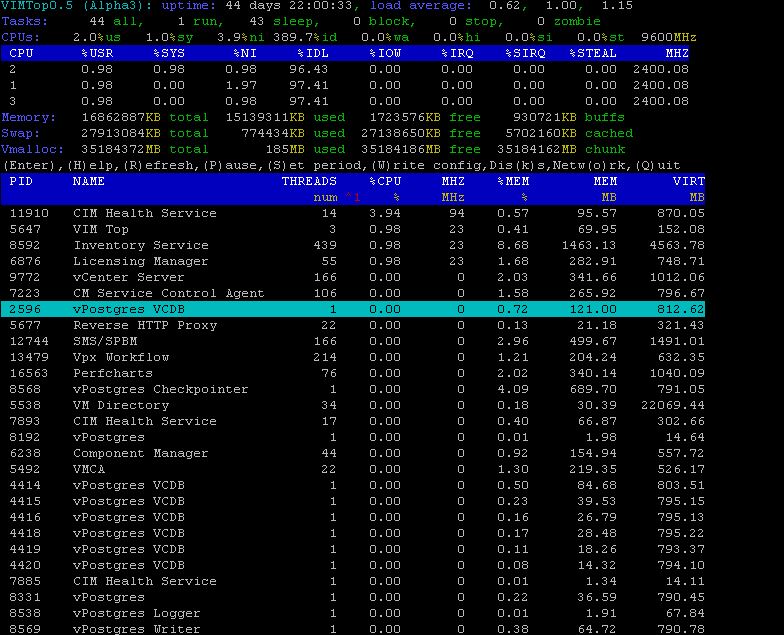
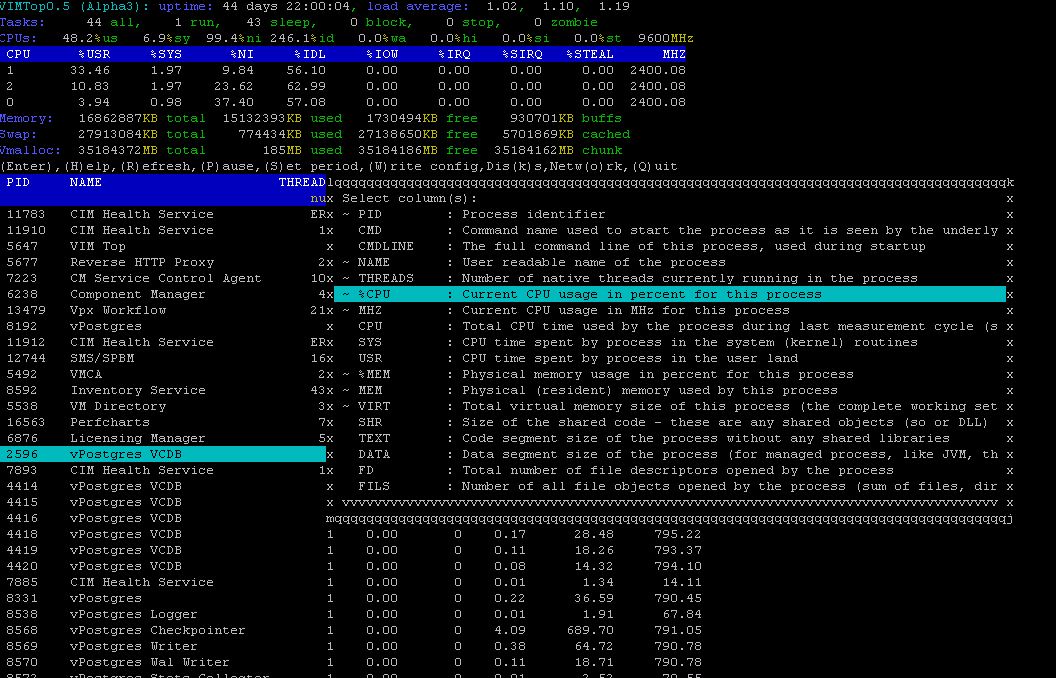
vimtop looks very similar to esxtop but you will quickly notice there are many UI improvements which really makes navigating the interface much simpler. The first thing that should stand out to you is the use of colors to help improve the readability of all the metrics. You will also notice that you can quickly navigate through current list view by either scrolling up and down or side to side using the directional arrow keys. When a item is selected is also clearly highlighted which is a huge plus in my opinion when needing to troubleshoot and watch for a particular entry or stat.
Find the below image shows selecting a specific row in vimtop .

There are three primary views in vimtop: Processes, Disks & Networks statistics which can be toggled using keyboard shortcuts. All navigation is performed through a series of global keyboard shortcuts similar to esxtop. There is actually a quite a few of them and you can quickly see the list by hitting the “h” key at any time for the help menu.
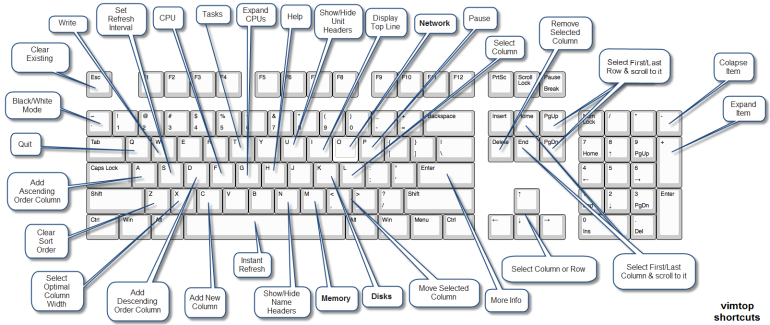
Here is the complete list of keyboard shortcuts for your reference
| Keyboard Key |
Description |
| esc |
Clear existing selection and jump back to Process view |
| w |
Write the configure out the current settings goes to a configuration file located in vimtop/vimtop.xml |
| s |
Set the refresh interval (seconds) |
| f |
Display all available CPUs overview |
| t |
Display Tasks currently managed by the appliance |
| g |
Expand top 4 physical CPUs currently available to the appliance |
| h |
Help menu |
| u |
Show/Hide the unit headers |
| i |
Show/Hide the top line |
| o |
Network view |
| p |
Pause the screen |
| l |
Select a particular column |
| delete |
Remove selected column |
| PgUp/PgDn |
Select first and last row and scroll to it |
| – |
Collapse selected item |
| + |
Expand selected item |
| home/end |
Select first and last column and scroll to it |
| left/right arrow |
Select column |
| up/down arrow |
Select row |
| enter |
Display more info about a select item |
| < |
Move selected column to the left |
| > |
Move selected column to the right |
| k |
Disk View |
| m |
Display memory overview information |
| n |
Show/Hide the name headers |
| c |
Add new column |
| d |
Add selected column in descending order or to switch column to descending order |
| x |
Select optimal column width |
| z |
Clear sort order |
| a |
Add selected column in ascending order or to switch column to ascending order |
| q |
Quit |
| ~ |
Display vimtop in Back/White mode |
If you are more of a visual person, I have also created a visual keyboard layout of all the vimtop commands which might be handy to print out and post on your wall. I actually got this awesome idea from one of our internal Wikis and I have created a new layout to match all the commands that are currently in vimtop.

For each of the three views, you can also add and remove different columns just like you could with esxtop using the “c” character. You can then select or de-select columns by using the spacebar for the metrics you wish to be displayed in the current view.

I figure it would also be useful to have a table of all the metrics and their definitions as it is a bit difficult to read while in vimtop itself.
PROCESSES
| Metric ID |
Description |
| PID |
Process identifier |
| CMD |
Command name used to start the process as it is seen by the underlying system |
| CMDLINE |
The full command line of this process used during startup |
| NAME |
User readable name of the process |
| THREADS |
Number of native threads currently running in the process |
| %CPU (CPU Usage) |
Current CPU usage in percent for this process |
| MHZ |
Current CPU usage in MHz for this process |
| CPU |
Total CPU time used by the process during last measurement cycle (sum of cpu.used.system and cpu.used.user) |
| SYS |
CPU time spent by process in the system (kernel) routines |
| USR |
CPU time spent by process in the user land |
| %MEM (Memory Usage) |
Physical memory usage in percent for this process |
| MEM |
Physical (resident) memory used by this process |
| VIRT |
Total virtual memory size of this process (the complete working set including resident and swapped memory) |
| SHR |
Size of the shared code – these are any shared objects (so or DLL) loaded by the process |
| TEXT |
Code segment size of the process without any shared libraries |
| DATA |
Data segment size of the process (for managed process like JVM this includes the managed code also) |
| FD |
Total number of file descriptors opened by the process |
| FILS |
Number of all file objects opened by the process (sum of files directories and links) |
| FILE |
Number of regular files currently opened by the process |
| DIR |
Number of directories currently opened by the process |
| LNK |
Number of symbolic links currently opened by the process |
| DEVS |
Number of devices (char or block) opened by the process |
| CHAR |
Number of descriptors opened to character devices |
| BLCK |
Number of descriptors opened to block devices |
| CHNS |
Number of all communication channels opened by the process (either sockets or FIFOs) |
| SCKS |
Number of sockets (TCP|UDP|raw) currently opened by the process |
| FIFO |
Pipes (named or not) opened by the process |
DISKS
| Metric ID |
Description |
| DISK/PART |
Storage disk / partition identifier |
| IOS |
Number of I/O operations currently in progress on this disk (should go to zero) |
| IOTIME |
Milliseconds spent doing I/O operations on this disk / partition (increases for a nonzero number of I/O operations) |
| LAT |
disk / partition access latency (in milliseconds) calculated using the total amount of time spend doing I/O divided by the total amount of I/O operations done during last measurement interval |
| READS |
Number of reads issued to this disk / partition and completed successfully during last measurement interval |
| RDMRG |
Adjacent to each other reads on this disk / partition merged for efficiency |
| READ |
Number of reads per second issued to this disk / partition |
| RDSCTRS |
Number of sectors read successfully from this disk / partition during last measurement interval |
| WRITES |
Number of writes issued to this disk / partition and completed successfully during last measurement interval |
| WRMRG |
Adjacent to each other writes on this disk / partition merged for efficiency |
| WRITE |
Number of writes per second issued to this disk / partition |
| WRSCTRS |
Number of sectors wrote successfully to this disk / partition during last measurement interval |
NETWORKS
| Metric ID |
Description |
| INTF |
Interface name |
| TRGPT |
Total throughput of this interface (Rx + Tx) in kilobytes |
| RATE |
The activity of this network interface in kBps |
| RXED |
Amount of data (in kilobytes) received during last measurement interval |
| RXRATE |
Rate of received data through this interface in kBps |
| TXED |
Amount of data (in kilobytes) transmitted during last measurement interval |
| TXRATE |
Rate of data transmission through this interface in kBps |
| RXMCAST |
Number of multicast packets received on this interface during last measurement interval |
| RXDROP |
Number of data rx-packets dropped during last measurement interval |
| TXDROP |
Number of data packets dropped upon transmission during last measurement interval |
| DROPPED |
Number of dropped packets through this network interface because of running out of buffers during last measurement cycle |
| ERRS |
Total number of faults (Tx and Rx) on this interface |
| RXERRS |
The sum of receive errors rx-fifo errors and rx-frame errors |
| TXERRS |
The sum of transmit errors tx-fifo errors and carrier errors |
| FIFOERRS |
FIFO overrun errors on this interface caused by host being busy to serve the NIC hardware |
| CLLSNS |
Collisions detected on the transmission medium |
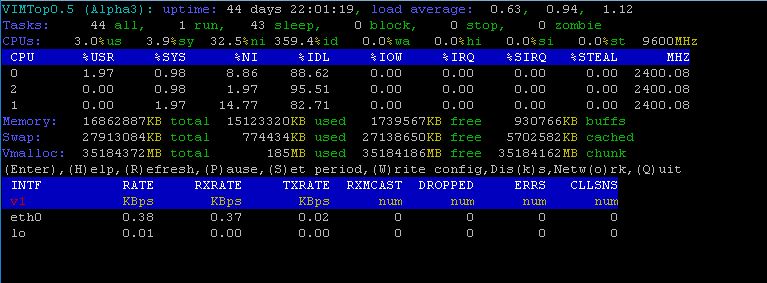
Click on “o” to switch to Network performance view of vCenter Server appliance. It displays as similar to esxtop such as RXRATE, TXRATE, dropped ,errors in the VCSA network stats.
