In this Post I am going to discuss about how can we monitor and manage the snapshot using Opvizor Performance Analyzer.
What is Snapshot?
Snapshot is a feature by vSphere preserves the state and data of a virtual machine at a specific point in time.
- The state includes the virtual machine’s power state (for example, powered-on, powered-off, suspended).
- The data includes all of the files that make up the virtual machine. This includes disks, memory, and other devices, such as virtual network interface cards.
As we all know that snapshot if one the cool features provide the vSphere and it is really helpful for System administrators. Snapshot has ability to return to stages of virtual machine when it has taken. But Most of the It infrastructure facing challenges with snapshot management.
How snapshots affect your virtual environment
First we have to understand that Snapshot is not a backup solution, it is a feature that supports backup , check the post for more information about virtual machine backups . Snapshots uses more disk space if you don’t monitor and manage your virtual environment regularly. Many invalid snapshots occur automatically when virtual machine backup runs. Backup solutions trigger snapshot creation and deletion and when backup solution failed to crate / delete snapshot in same time there will be orphaned snapshot. Orphaned snapshots will grow with virtual machine and it will consume most of your free space. Also due to this the virtual machine performance will impacted.
Opvizor will help you to handling this situation, Opvizor will do in-depth analysis of snapshot on your virtual environment. You can see all details in a beautiful dash board and it is understandable to everyone. Also there is option to generate report of the snapshot details and sent through mail and this report can be scheduled. Best thing I Love the real time monitoring through Opvizor, it has option to get the information in with different time frame option which is very useful .
Here will show you live scenario of snapshot management using Opvizor Performance Analyzer
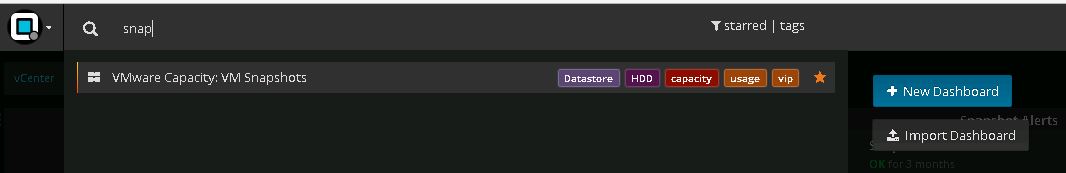
Select the VMware Capacity : VM Snapshots dash baord from dashboard option or You can find this dashboard by click inside of the search field.
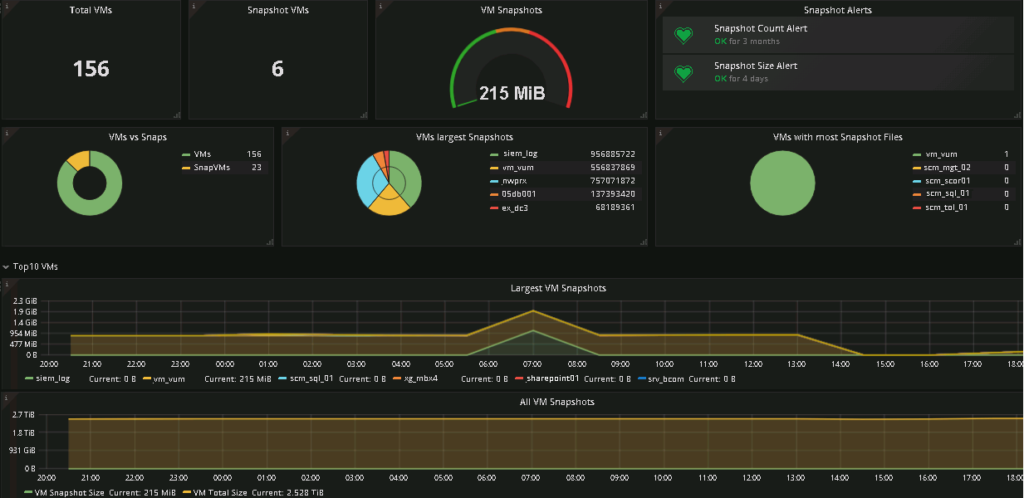
Below image is prebuilt VMware Capacity : VM Snapshot dashboard view of Opzior .
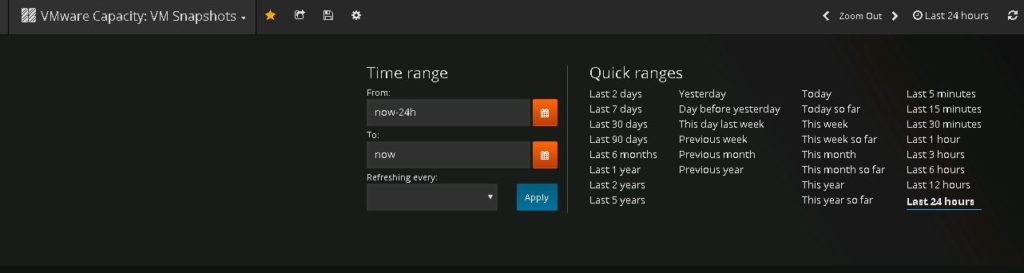
Right side of the Dash board you can select the time for generating the data to dash board .
As of now there is only one snapshot available , I have created snapshot which is used for one of reporting services which is actively collecting data . Will wait for few mint and see the new snapshot information is available in dash board or not .Data collection is happening very frequently so it is easy to monitor the new snapshot information quickly once it created from any .
Next we will monitor the snapshot growth after some .
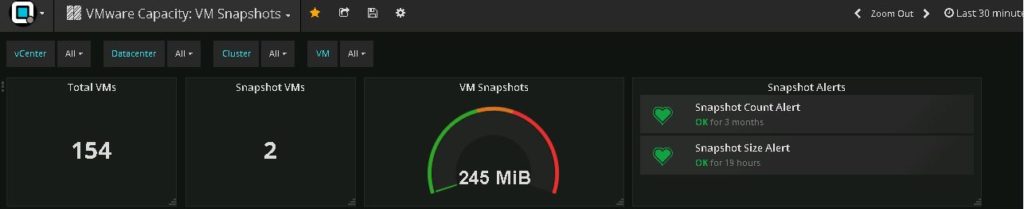
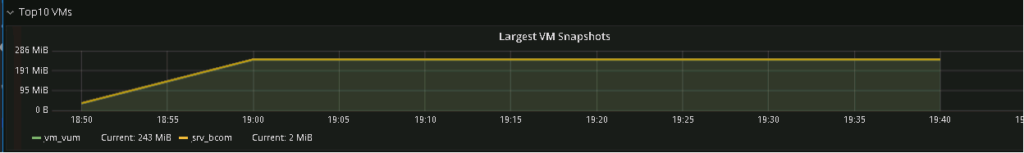
In 1 hour growth of the virtual machine snapshot is 245 MB from 37.4 MB . This is how opvizor monitor , This is one the best tool to monitor deeply your virtual infrastructure .
Next Lets check the snapshot data growth in detail , We can get the information such as what time snapshot has taken what was the usage on that time , and the snapshot size growth with time .
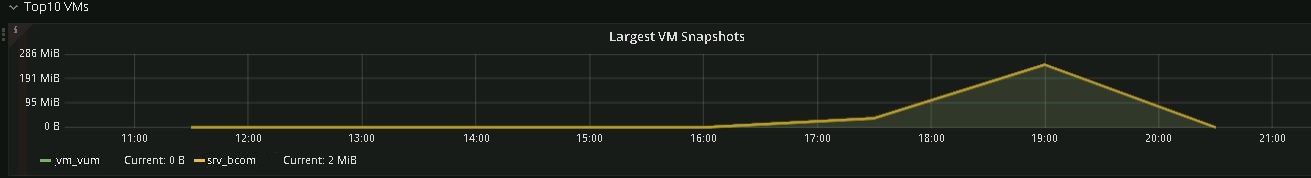
Here we are using two VM one is in powered off state which is having only 2 MB snapshot and another one actively working and shows snapshot size growth . Just imagine if you have many servers in production having snapshot , soon your your datastore will become full and it will lead to outage / performance degrade of server , aslo it will affect other virtual machines in same datastore because there will not be enough space .
Here the line charts are more important to see the changes , check the below line chart after removing the snapshot
When it comes to widgets that shows current, average, max values which means
Current – always the last value, no matter what time frame
Average – average value during the selected time frame
Max – maximum value during the selected time frame
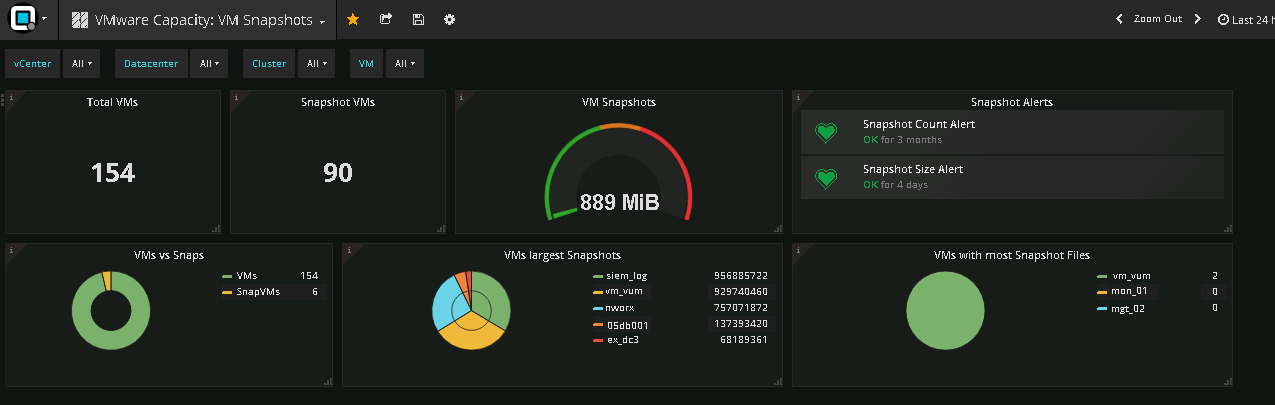
And After one day i has checked same and I found there was some activity running for snapshot because the report shows 90 snapshots and it was related my vm backup , and on the right side it shows recent snapshots which means only two snapshot left all other is deleted . This is the same VM which we were testing “VM-VUM” See the growth of snapshots from 245 MB to 889 Mb .
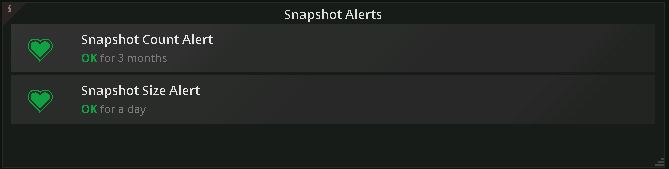
Snapshot Notification In Opvizor
Additionally opvizor has great feature for configure the alerts on Snapshot space or Snapshot count and send through E-Mail.You cannot monitor the virtual machine snapshot growth always , so this this alerting system will notify you through email when the threshold exceeds which you have configured over there .
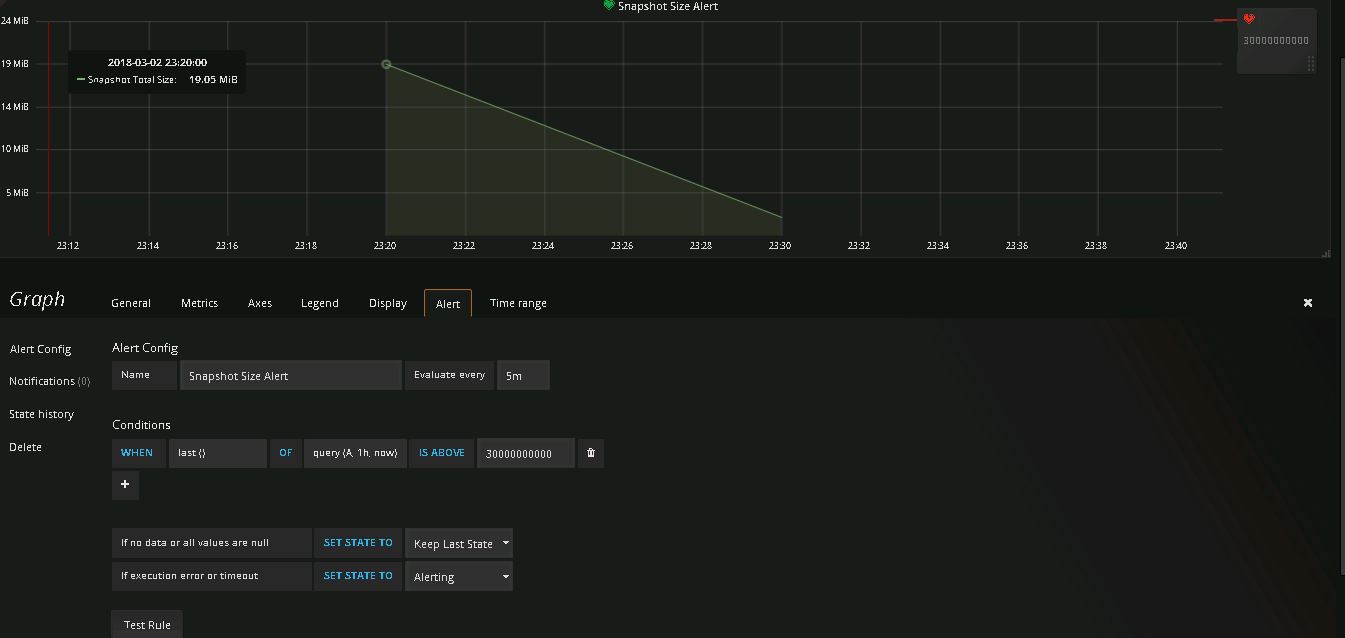
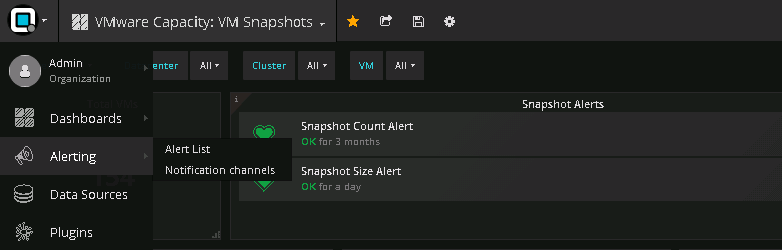
Select the one which you want to modify the setting , Count / Size Alert and modify the values from the opening page .
Here we selected the snapshot size alert , you can modify the values from the options alert configure available there , Also from same windows click on notification and you can add the message to delivered with notification and the mail id .
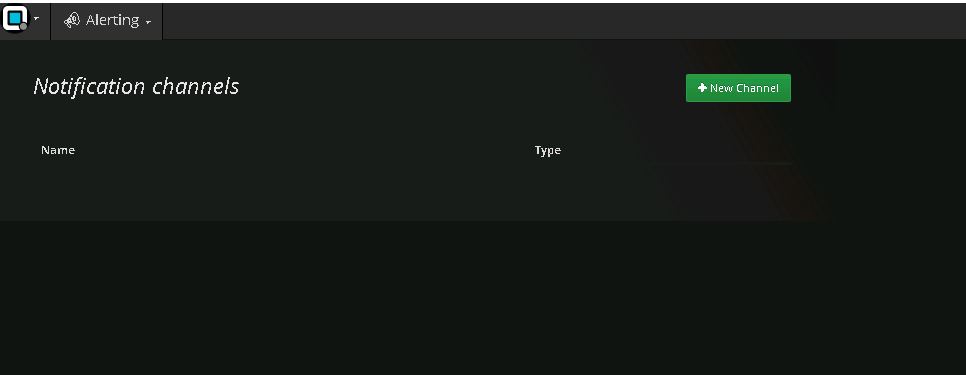
Also from the menu you configure the notification by select Alerting – > Notification Channels
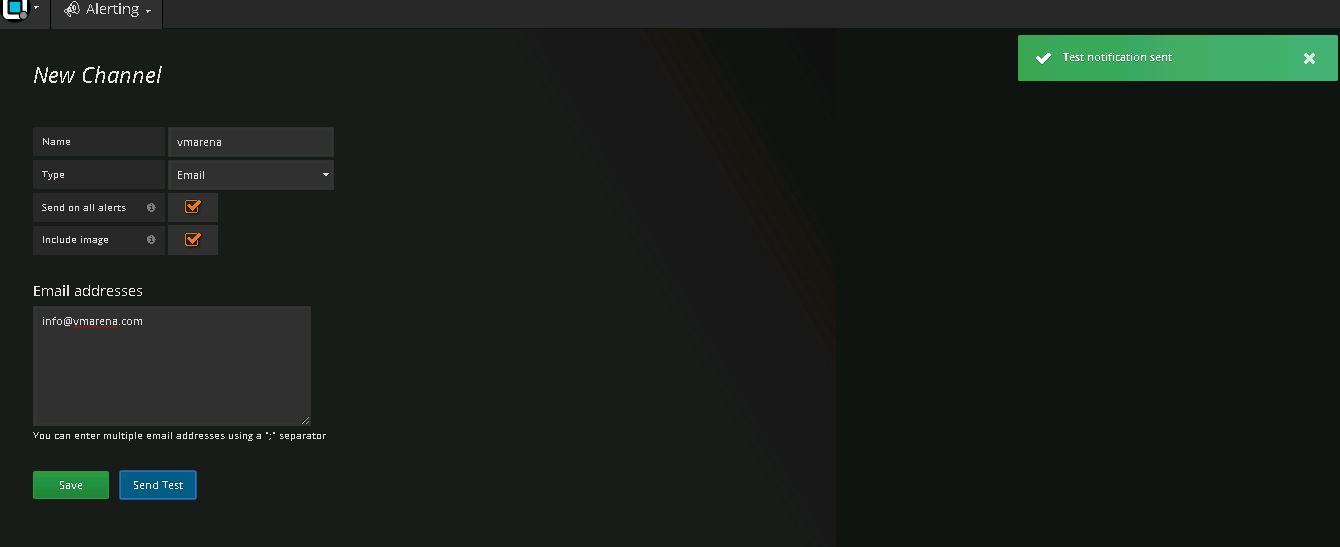
Select the option Add New Channel
Add the required fields and do a test by clicking on send test and you can see a test mail in your inbox .
Note :Alerts can be configured from Alert Tab on the graph panel from any bash board with existing queries .
Additionally there is another wonderful tool – snapwatcher by opvizor to manage your snapshots . By using snapwatcher you can check individual snapshot details and delete them also .Also you can find and manager all invalid or broken snapshots created by actions such as backup solutions using snapwatcher .